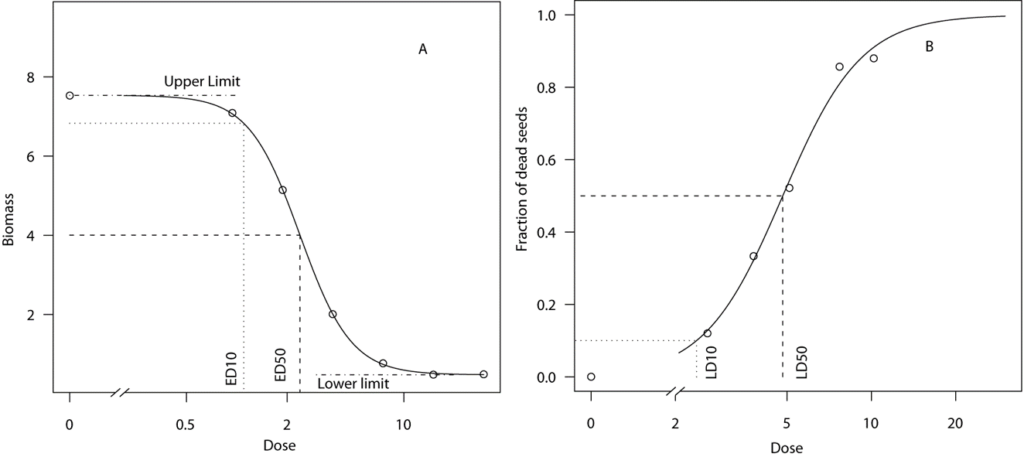
Different endpoints
In the study of bioassay the classical approach was to expose a number or organism to a suit of doses and use the survival rate of the organisms as endpoint. Conveniently the upper and lower limit of the binomial response are defined between 0 and 1, that is the effect of zero dose and the effect of large doses to completely kill the organism. A binomial response is a sum of independent binary responses: 0/1, no/yes, or absent/present; a binary response is a special case of a binomial response.
The total number of binary responses per dose is decided upon as part of the experimental design and, hence, it is known in advance, prior to observing the responses. These total numbers need not be the same for all concentrations. In some cases, the dose-response models for binomial data will be special cases of generalized linear models for binomial data (e.g., experiments eliciting the full range from 0% to 100% response).
In weed science which triggered the development of drc package the most common endpoint is a continuous one. Specifically, a continuous response is a quantitative measurement that may take any value within a certain (possibly unlimited) range and is usually expressed in a quantitative unit such as color, length, mass, and volume.

For continuous dose-response data, we will assume a statistical model where each response value y may be decomposed into two additive contributions. One contribution is determined or predicted by the corresponding dose through the assumed model function. It will be the same contribution every time the same dose is applied; it is a fixed contribution for each dose. This contribution corresponds to the average response for a given dose. The other contribution is random, i.e., it will change from one replicate to the next, modifying the average response value in an unpredictable way. The randomness may, however, be characterized by a probability distribution that quantifies how likely the contribution is to take values in any given interval of response values. As these random contributions will modify the average response by adding or subtracting some value, we say that the probability distribution is centered around the mean (response). This statistical model.
